SparkMonitor
Final Report | Installation | How it Works | Use Cases | Code | License
A simple example notebook
Introduction
This notebook tests a majority of Spark API through pySpark. It mainly covers most RDD APIs and runs a random job. It also simulates some errors in Spark Jobs to test the extension
Notebook
Environment
- This notebook was run with a local Apache Spark installation, using 1 executor and 4 cores.
Monitoring the Notebook
Automatic Configuration
- The extension automatically provides a SparkConf object to enable monitoring. This object might optionally be completed by the user with additional configuration to start the Spark Application.

Features
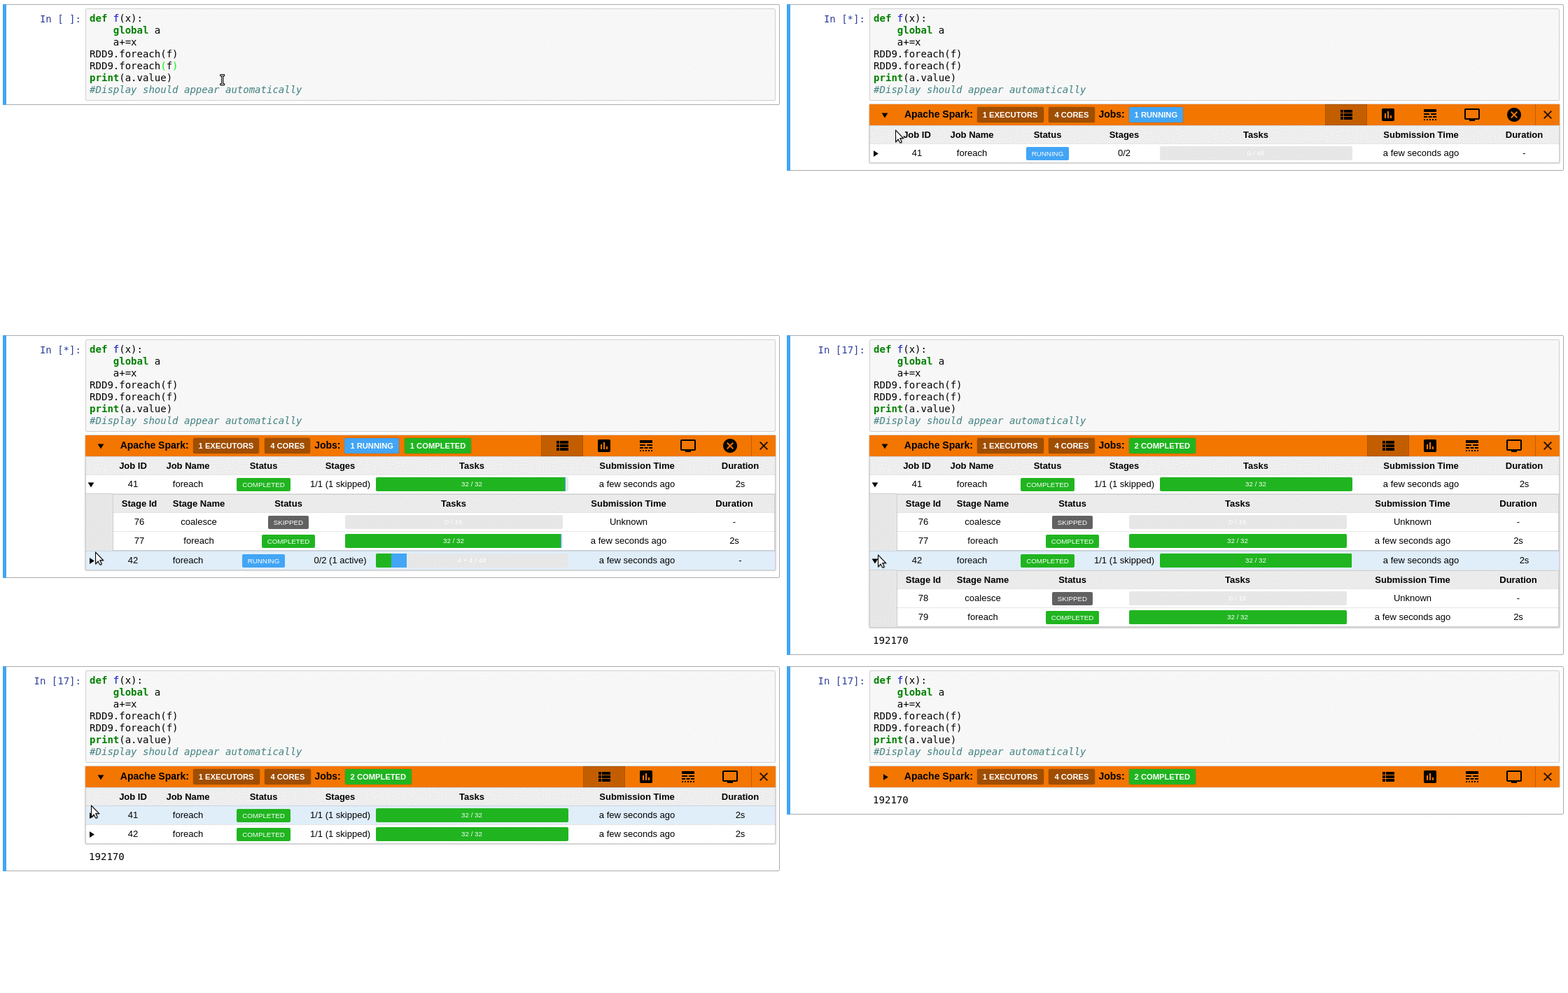
- A table of jobs and collapsible stages shows the jobs started by the current cell.
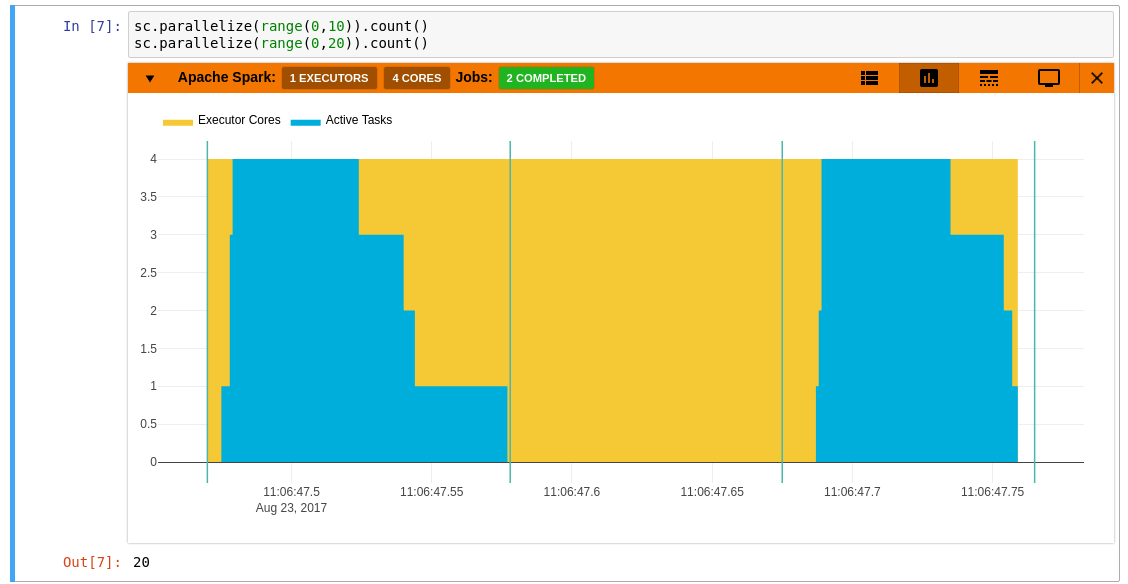
- An aggregated view of resource allocation - a graph between number of active tasks and executor cores. The green vertical lines show jobs start and end points. Looking at this graph, it is possible to determine at any instant the amount of executor resources utilized, and the amount that remained idle. A job that is stuck waiting for a previous result, would delay the result of the entire computation. The yellow areas in the graph are the executor cores that remained idle at that instant. A workload with more yellow implies that it is under utilizing cluster resources and not efficiently running in parallel.
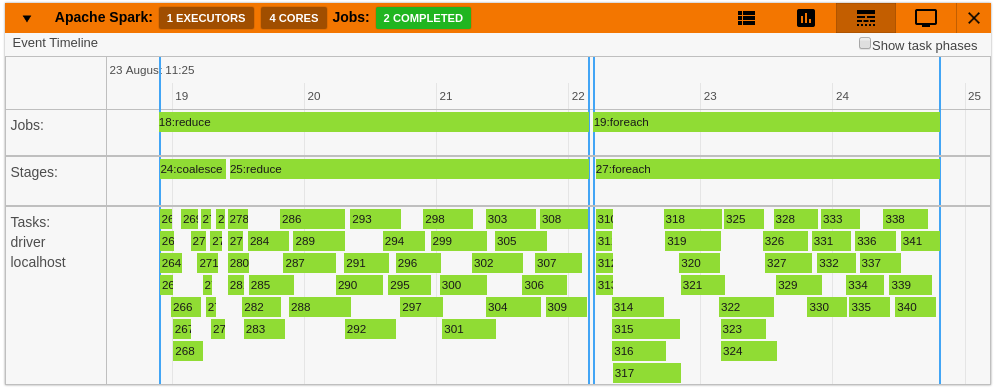
- An event timeline. The timeline shows jobs stages and tasks in each executor running on the cluster. It shows the overall split up of the job’s tasks across executors. Clicking on an item gives more details about it. The timeline gives a picture of what is running in the cluster. It also helps locate bottlenecks and detect any kind of delays due to particular tasks delaying the result.
Detecting Failures
- Failed jobs show up with a red status on the title.

- In the timeline failed jobs are highlighted in red.
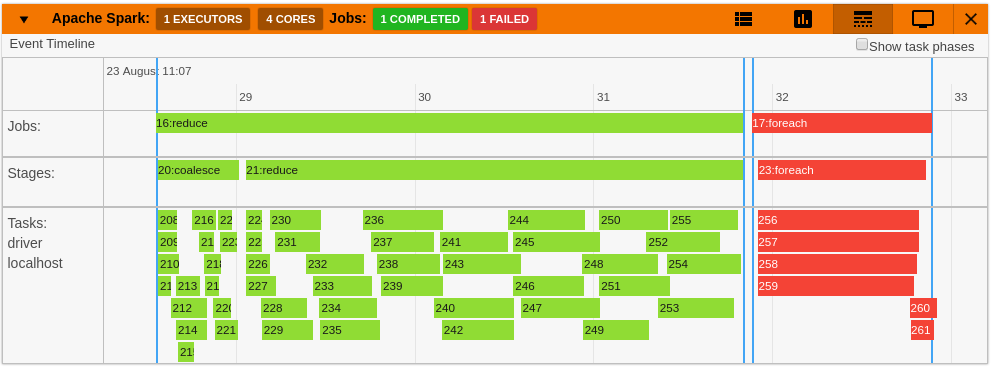
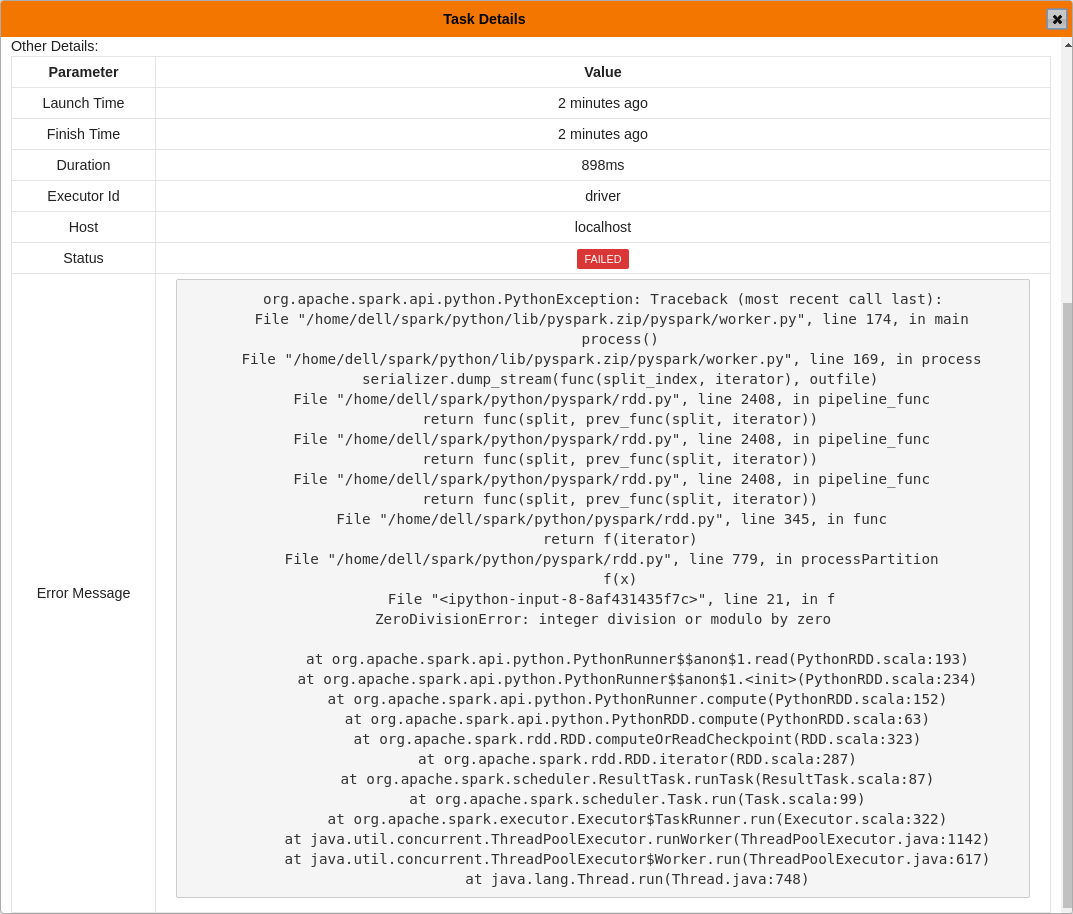
- Clicking on a failed task shows the failure reason with the stack trace.
Too many cells with Spark
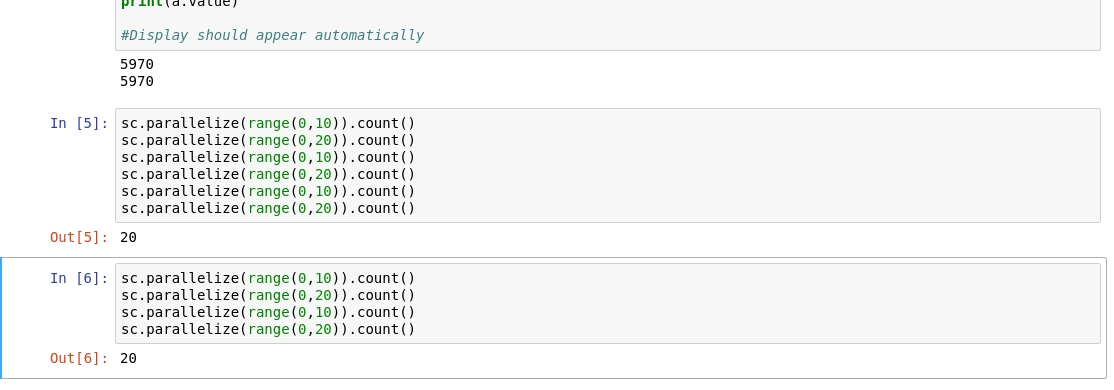
- In some cases there are too many cells with trivial Spark Jobs, in these cases monitoring is not really necessary. So the extension provides features to collapse/hide the display.
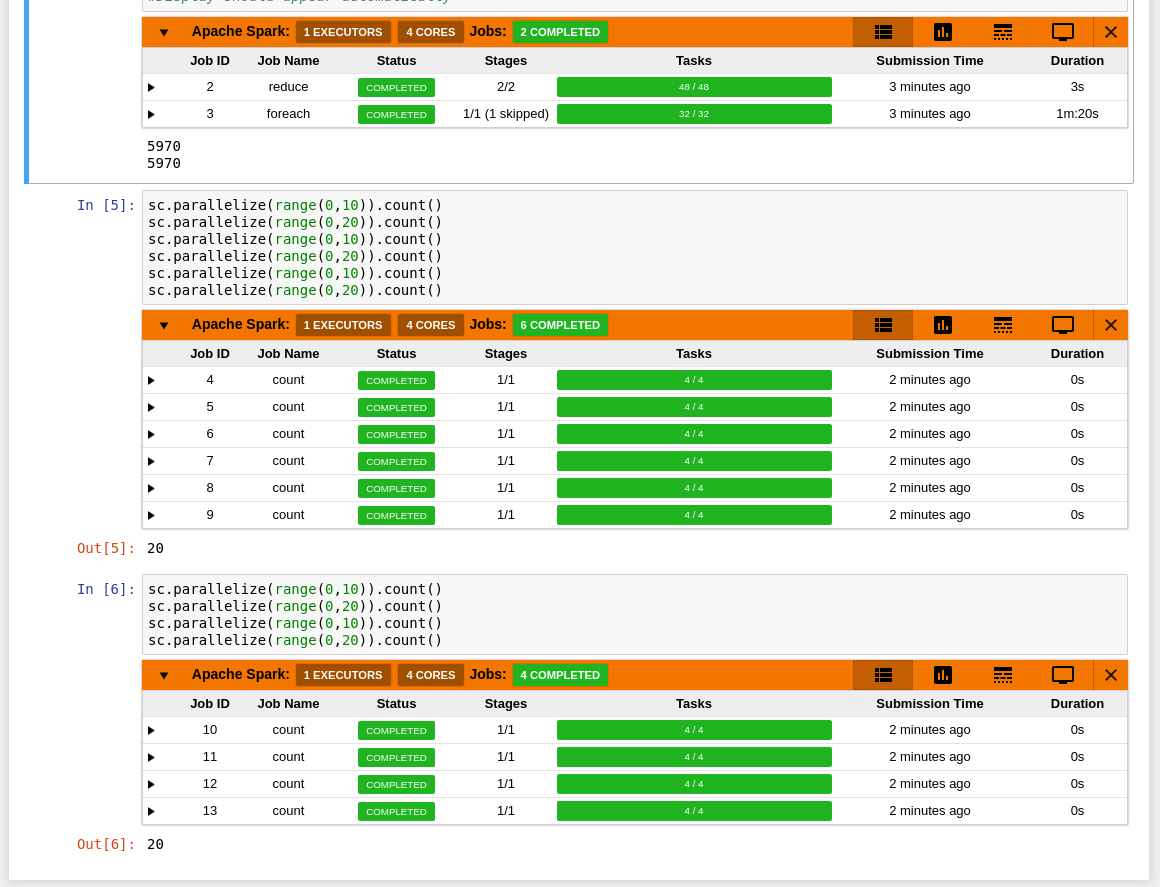
- All monitoring displays can be easily be hidden and shown using the button on the toolbar.

- An individual display can be minimized by clicking on the arrow on the top left corner.

- Clicking on the close button on the top right corner hides the display all together.